What’s the West of England region’s solar electricity generation capacity today? How much more could there be if we covered every roof with solar panels? How about the current state and future prospects for onshore wind? Biomass? Electricity from waste? And how does all this compare with what we want – or what we will need?
These aren’t questions I could answer, off the top of my head. But there’s now a model that brings all this information together, and gives the best possible grounding for conversations about our energy future. It should be the springboard for a lot of work that Zero West does next year and beyond.
Here’s why. We can’t know what the future will look like. But we do know we have to start from here. We’re committed to working through the implications of that for the shift to zero carbon living.
And, thanks to a lengthy effort by our data working group, we’ve now got the essential outline of our energy system, based on real numbers. It details demand and supply across our region. And we’ve started to draw out the implications for where we can get to, and how.
The spirit of this effort is very much in line with the late David Mackay’s celebrated book Sustainable Energy Without the Hot Air. His insistence that useful talk about energy must rely on defensible numbers, and showing your working, remains inspiring. (The book’s a bit out of date now, but you can still download it here.)
Our own model is an extension of a pioneering effort by Wales and West Utilities (WWE), who deliver our regional gas supply. They built a model of energy supply and demand for their own use, to help imagine the future of the energy grid in a more complex, highly distributed system. In their words, “The 2050 Energy Pathfinder has been built to assess the feasibility of how different future energy mixes would work in practice. It enables any energy scenario, current or future, to be modelled for a town, city, county or country and the results show the costs, carbon impact and any shortfall/surplus in heat and power supply. The simulator can determine the feasibility of alternate solutions across all energy types in a more integrated way.” (Read more about that here).
We’re not going to share all our work just yet. But here are some personal impressions from a recent workshop which showed some of the results for the first time. We have a model of energy use that looks very instructive. What does it do, and what can we do with it next?
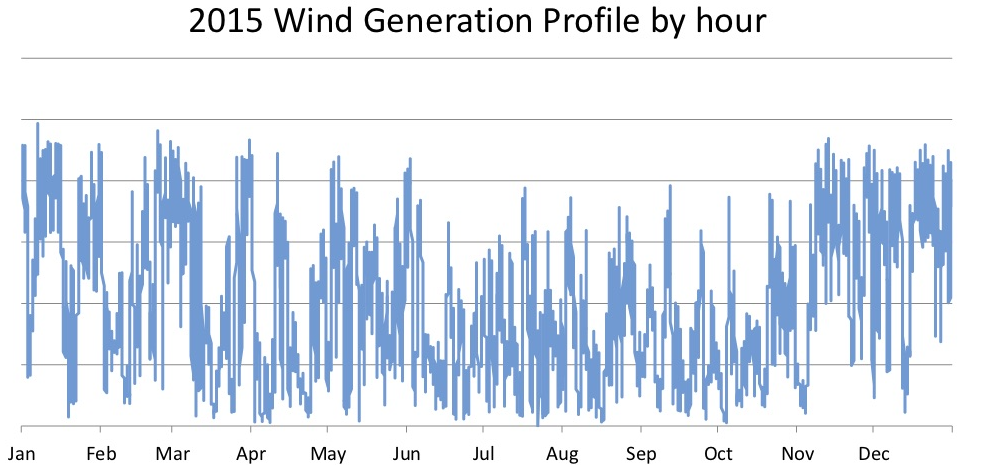
The power of WWE’s system simulation, which we’ve adopted with their blessing, is that it shows hour by hour matching (or mismatching) of demand and supply. This is a key issue with renewables because of their daily and seasonal variation in performance, as roughly depicted below for UK wind.
That’s not to say the current numbers are easy to come by. We want to look at current energy consumption, and estimate the potential for renewable generation. Then we look at the hourly balances, and find where the pinch points are and how much energy storage would be needed, for example, to make the system work. And there’s the intriguing question how far we could get as a region to achieve energy self-sufficiency. That’s not essential – we will be able to draw on renewables sited elsewhere, especially offshore wind power. But it’s still instructive to see what the shortfall might be. And, of course, how it varies with different assumptions about future demand. How many electric cars will there be? How will we heat our homes? How much can we reduce demand in key sectors like transport or housing in a region whose population is expected to increase over the next decades?
The result, someone said, ought to be a “a really good evidence-based picture of what’s possible”. That will feed into our visioning work. As we imagine how we might live in the West of England, and ask what kind of future people want, we can refer back to the numbers and see how different options might work out.
The story so far
The current output is limited to a baseline data set and one main scenario for the future mix, adjusted for different levels of ambition. This post won’t go into details. One thing that seemed to happen at the workshop was that presenting one set of numbers makes people respond as if they are seeing a policy proposal. But the exercise should be seen more as a tentative set of “what if” questions, with rough numerical answers.
Still, the output of the model as it stands already told us a bunch of important things.
The biggest potential for renewable electricity from within the region, lies with solar. Some would be on roofs, some on the ground. Here’s one reason it makes sense to consider the four counties in our region. There’s a large city in the middle, but the region is 70 per cent agricultural land. That could put us in a much better position for solar – also for onshore wind and biomass – than the city alone could manage.
Add all those up, along with some energy from waste, and approaching self-sufficiency can look plausible, but only if there is a significant decrease in energy demand across the region – perhaps a third. It also becomes clear from the patterns of supply and demand that large-scale storage is likely to play a large role in any scenario for increased use of renewables. This is a huge issue for future planning. We need renewables, and they need a a vast storage and management system that where it exists is really at prototype phase. We can agree that renewables are now proven technology, but the ‘grid’ to go with them is not.
All that gives an idea of the kind of ideas this modelling leads to. And of the new questions it will raise. Hydrogen made by electrolysis might be the most flexible way to store surplus solar electricity, for example. It can be used to run fuel cells to make electricity again, or fed into the gas network (in limited amounts) to top up supply at peak demand. But who will run hydrogen storage? Where will it be? How often will we draw in electricity from the wider network to avoid blackouts?
Further on, we want to develop a picture of land use in the region in similar detail. Then one can look at the trade offs in different scenarios for changes in future use. Should we aim for more biomass energy crops, or cultivate new forests to lock up carbon from energy use elsewhere? And so on.
The point is to get a sense of how the ways we live, use land, eat, travel and manage our energy resources all interweave. You’ve seen that banner that says: “system change, not climate change”? This here’s a powerful way of seeing the workings of the system we need to change. Lara Balasz of Buro Happold also drew on the model at our event devoted to decarbonising heat – and you can download her presentation here.
There’s a lot more to do: refining the model, improving the data, and finding out how to present the scenarios clearly to provoke the most useful conversations. We’ll be presenting more details of the current work at our Winter Conference on 16th January. (Book for that here). It should be a useful way into regionalising the single local authority scenarios that are nw beginning to emerge. Meantime, if you’d like to help with this work, do get in touch!